memes.cjtrowbridge.com
Category: Urbanism - Transit -> This Meme
llama-3.2-vision
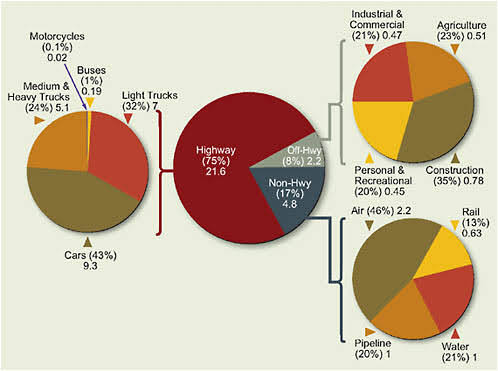
The image is a pie chart showing the distribution of transportation modes in the United States. The chart is split into four sections, labeled "Highway", "Air", "Water", and "Other", with corresponding percentages. The text "Transportation in the United States" appears above the chart.
first-seen
2023-05-10T21:04:28+00:00
tesseract
Industria & Canmore Aaretre Motorcycles CayOar (eh (0.1%) Veg 02 ea t NG f sadiom &\ 8) { | tony Treks ght trucks = vegas Ay BB? 4 } & ss Suc Rede n i \ on cy | ™ | tpt r reational (35%) 0.78 er Rect (35%) Gre) (20%) 0.45 ue Air (46%) 2.2 Rail v. (3%) oes a \ ars (49% ys a Pete oe (20%) 1 (21%) 1